Checkout our public roadmap, updates, help docs and more.
Checkout our public roadmap, updates, help docs and more.
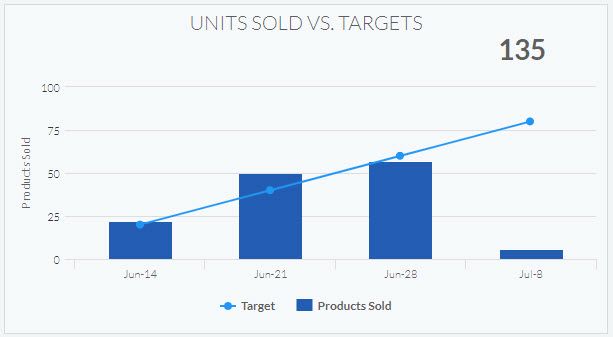
Looking to easily compare your number of units sold to target numbers you wish to hit... now you can!
Compare the number of units sold for all products you select vs. target numbers you wish to reach over a given date range.
You can customize which products to track, the date ranges and the target numbers you wish to set to quickly and easily see how your real numbers are performing compared to your targeted numbers.
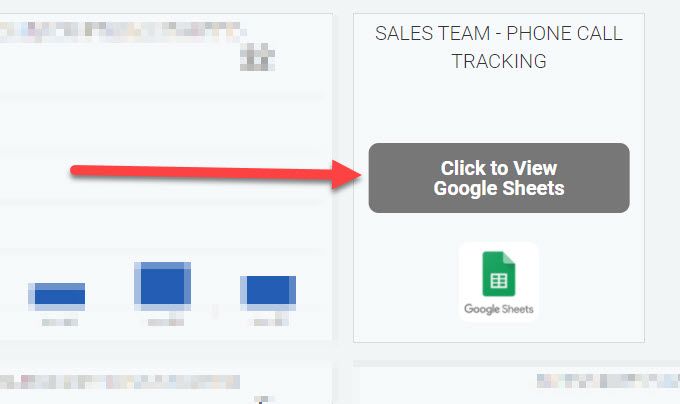
You can now access non-Graphly reports and spreadsheets (like Google Sheets and others) straight from your Graphly Dashboard.
This means you can link to ANY 3rd party report, spreadsheet or document straight to your dashboard to quickly access outside data from one place. No longer waste time tracking down links to additional data.
Below is an example of what it looks like. You have additional options to customize the widget title, add the hyperlink and to show or hide the button and/or thumbnail. Just click the big plus symbol (+) from your dashboard and select the "3rd Party Report" widget to customize your options.
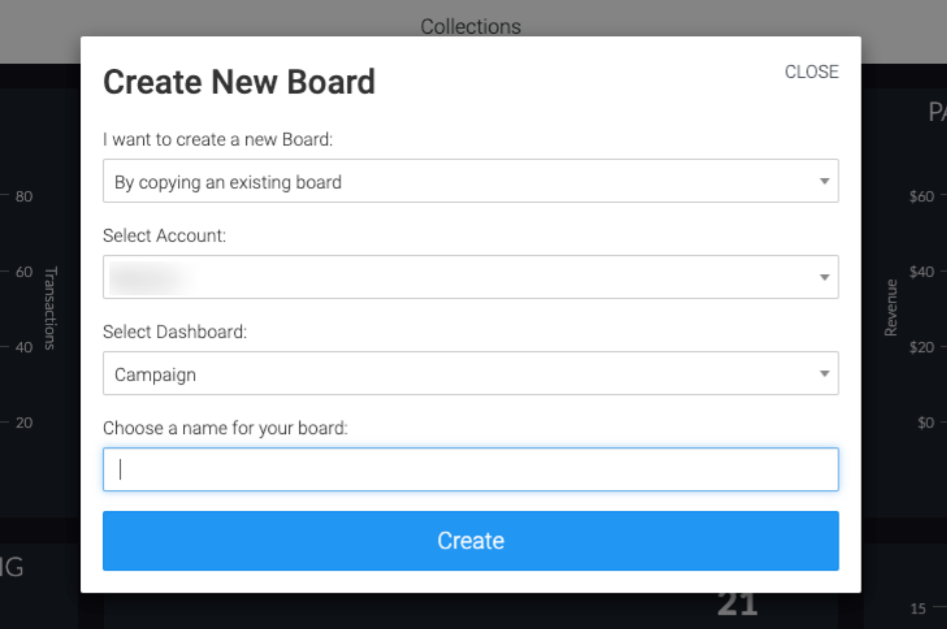
You can now copy a dashboard from your Graphly account to any other Graphly account you have access to! To learn more about this feature check out this help article.
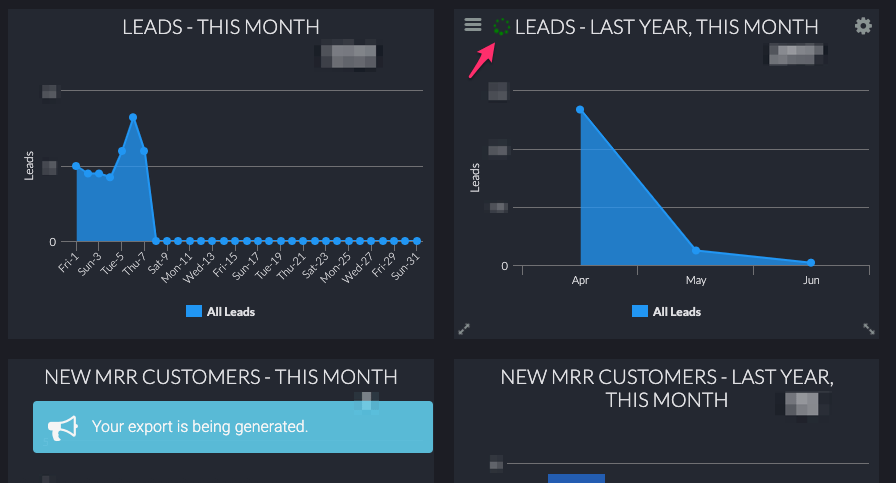
You can now export New Customer and New Customer Value reports to PDF format! Simply click the download icon in the top left corner of the widget. It will take a minute to generate the export.